Profile & Stats
Every tipster has a public profile page with a URL generated from their service name. The profile is divided into a header with key statistics and three tabs - Dashboard, All Picks, Months Overview.
Header & Stats Bar
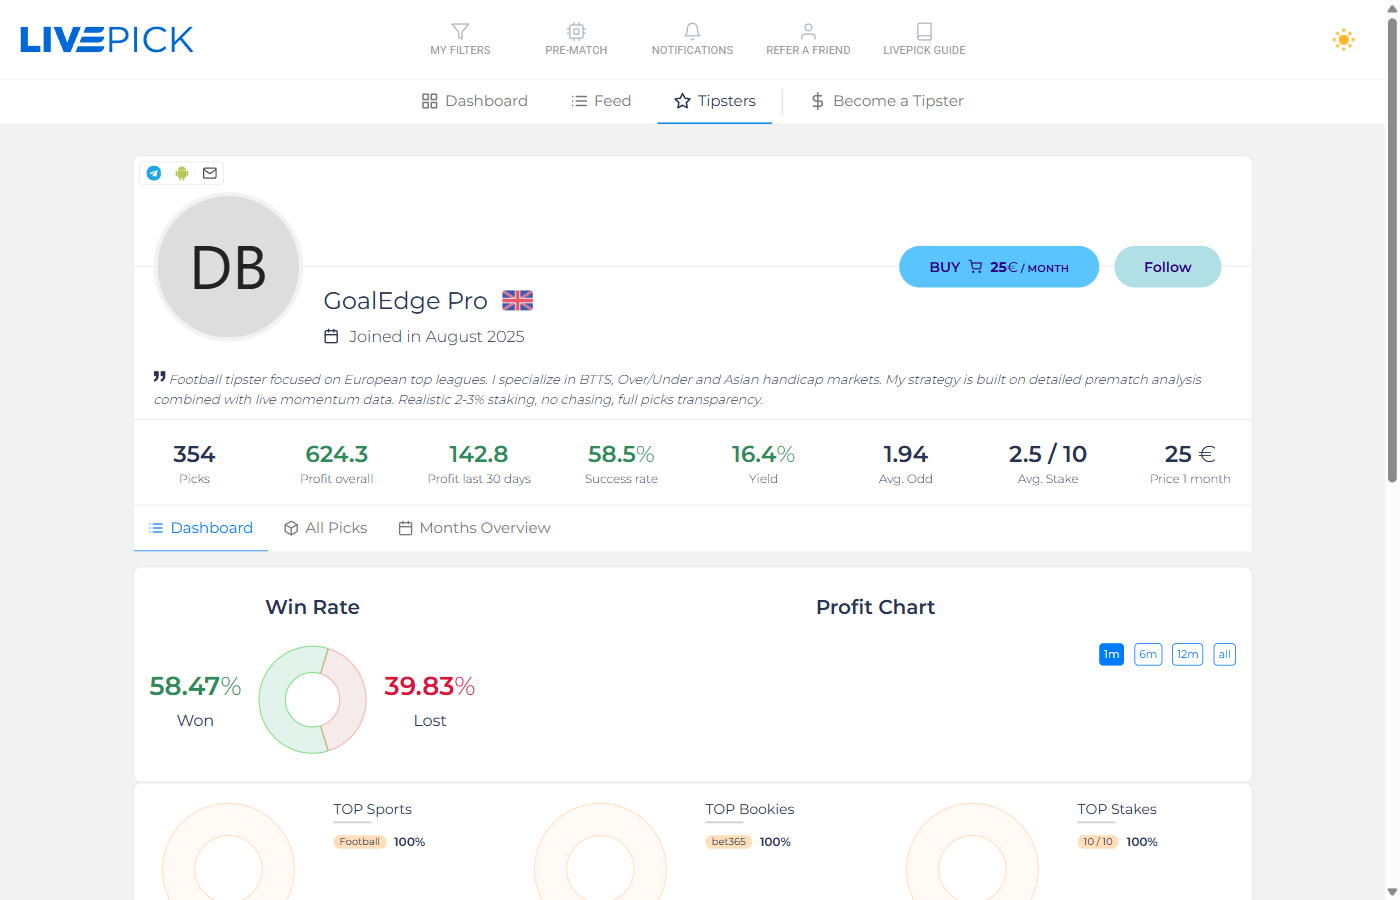
The header shows the tipster's avatar, name, country flag and the join date. On the right side you find the Subscribe button showing the monthly price, or FREE if the service has no price. There is no separate "follow" button any more: subscribing to a free service is itself free. If you are already subscribed, the button shows your remaining time and a Prolong option instead. The bio under the name briefly describes the tipster's strategy.
Below the header sits the stats bar - a row of verified numbers that cannot be edited after a pick is published:
- Picks - total resolved picks. The larger this number, the more reliable everything else is. We consider 30+ picks as a useful starting sample, 100+ as a meaningful long-term sample.
- Profit overall - sum of profits across the entire history in units. If the tipster always staked 2 units and the value is +120, it means +60 winning units worth of profit equivalent.
- Profit last 30 days - current form; useful to spot whether the tipster is on a hot streak or in a drawdown.
- Success rate - percentage of won tickets (excluding void picks).
- Yield - return on stake (ROI). Calculated as profit / total stake × 100. Long-term sustainable values are usually 3 % - 15 %. Values above 25 % over a small sample are suspicious.
- Avg. Odd - average price of resolved picks. Tells you whether the tipster bets favorites (1.4 - 1.8) or longshots (2.5+).
- Avg. Stake - average stake on a 10-unit scale. 2 / 10 means the tipster usually places 2 % of the bank per pick.
- Price 1 month - monthly subscription cost; 0 € means the service is free.
Dashboard Tab
The default tab gives you a visual overview of the tipster's performance.
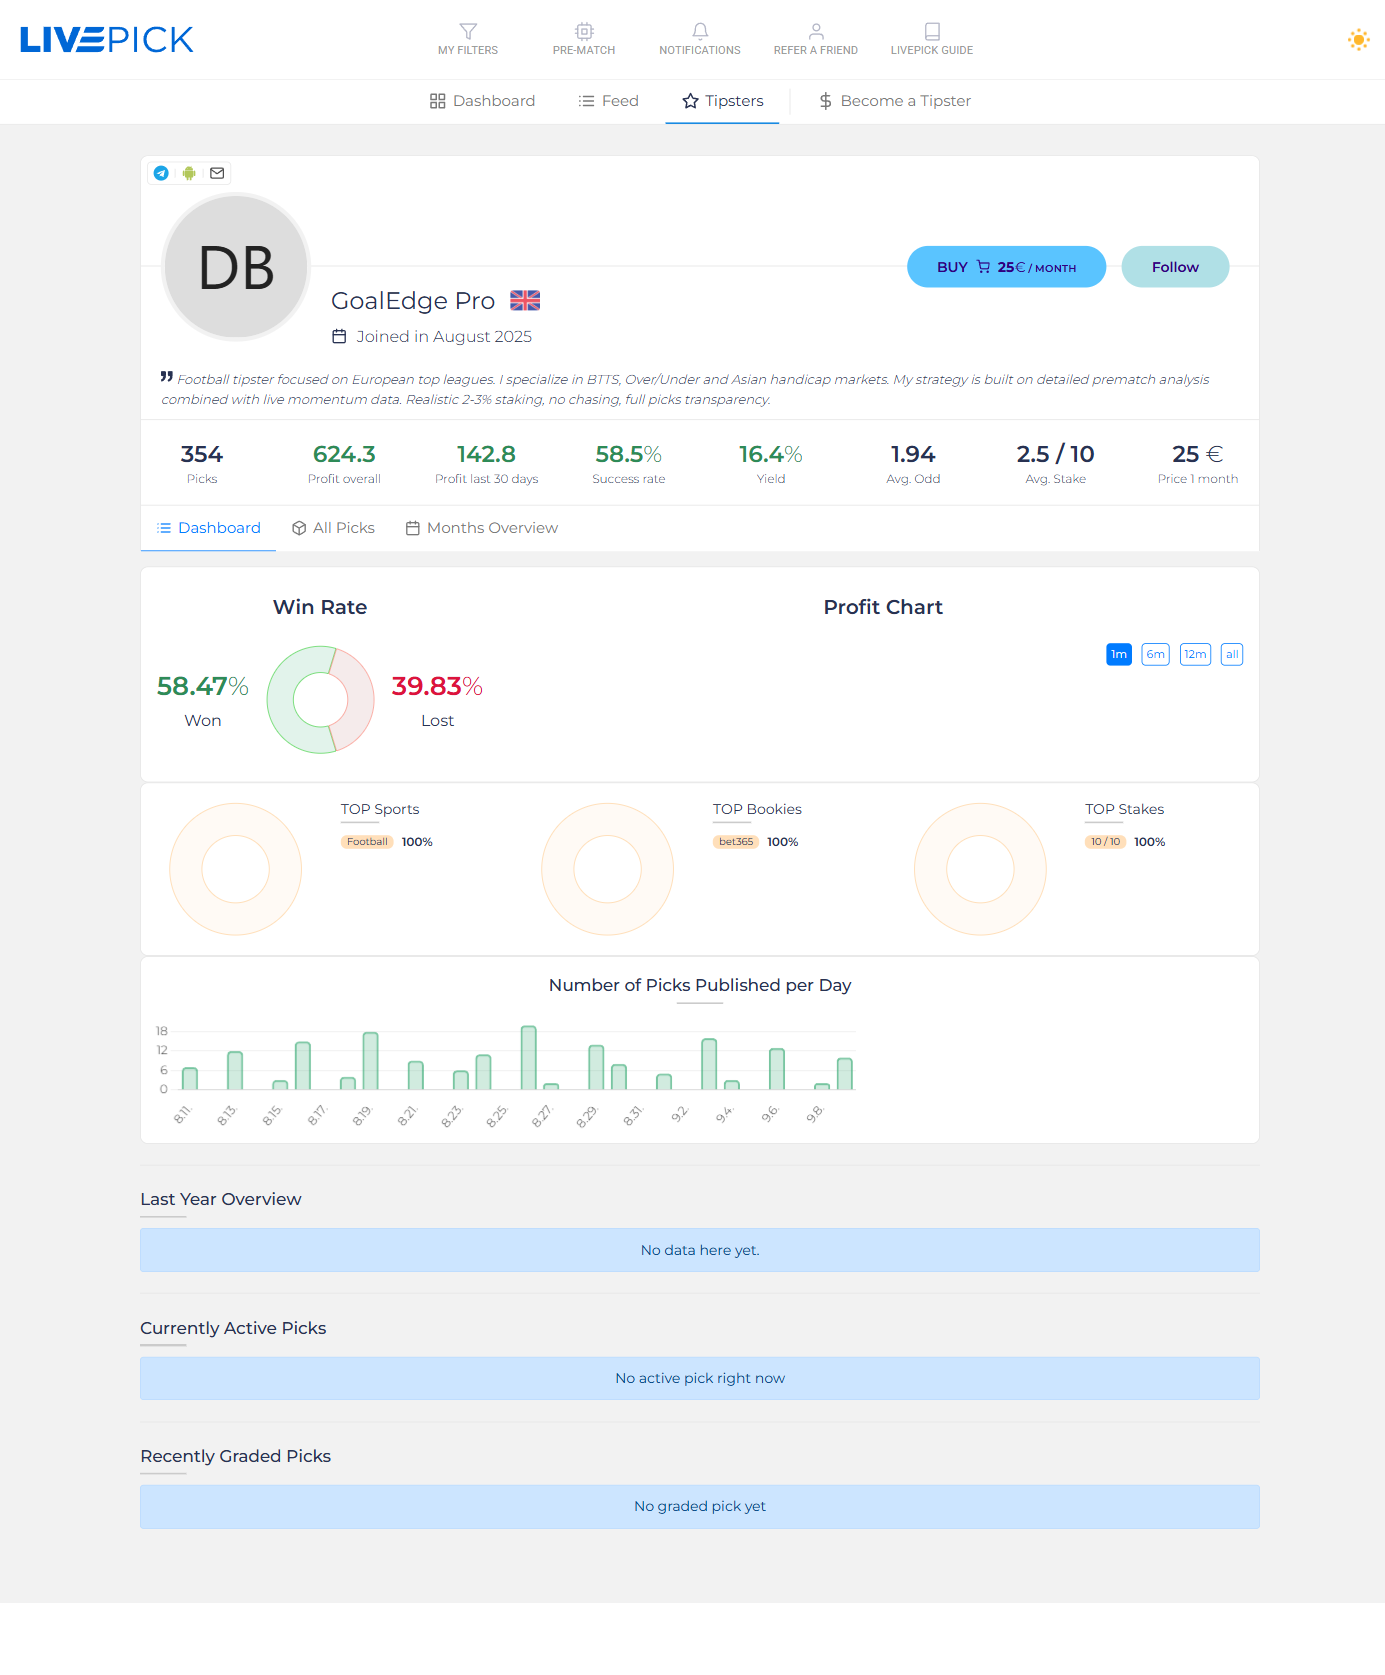
You can see:
- Win Rate donut - Won / Void / Lost percentages
- Profit Chart - cumulative profit over time, switchable between 1 month / 6 months / 12 months / all
- TOP Sports / TOP Bookies / TOP Stakes - donuts showing the share of each category in the tipster's picks; useful to verify whether the tipster has discipline (one preferred sport, a few preferred bookies)
- Number of Picks Published per Day - daily activity bar chart. Spikes can mean the tipster bets multiple matches a day, gaps mean the tipster takes breaks.
- Last Year Overview - monthly profit table for the previous 12 months
- Currently Active Picks - picks that are still live or upcoming and have not been resolved yet
- Recently Graded Picks - picks resolved in the last 24 hours
All Picks Tab
Full history of every published pick. Each row shows match, market, odd, stake, result and timestamp. This is the place to verify the tipster's track record - every entry is locked in at the time of publication, no after-the-fact edits possible.
Months Overview Tab
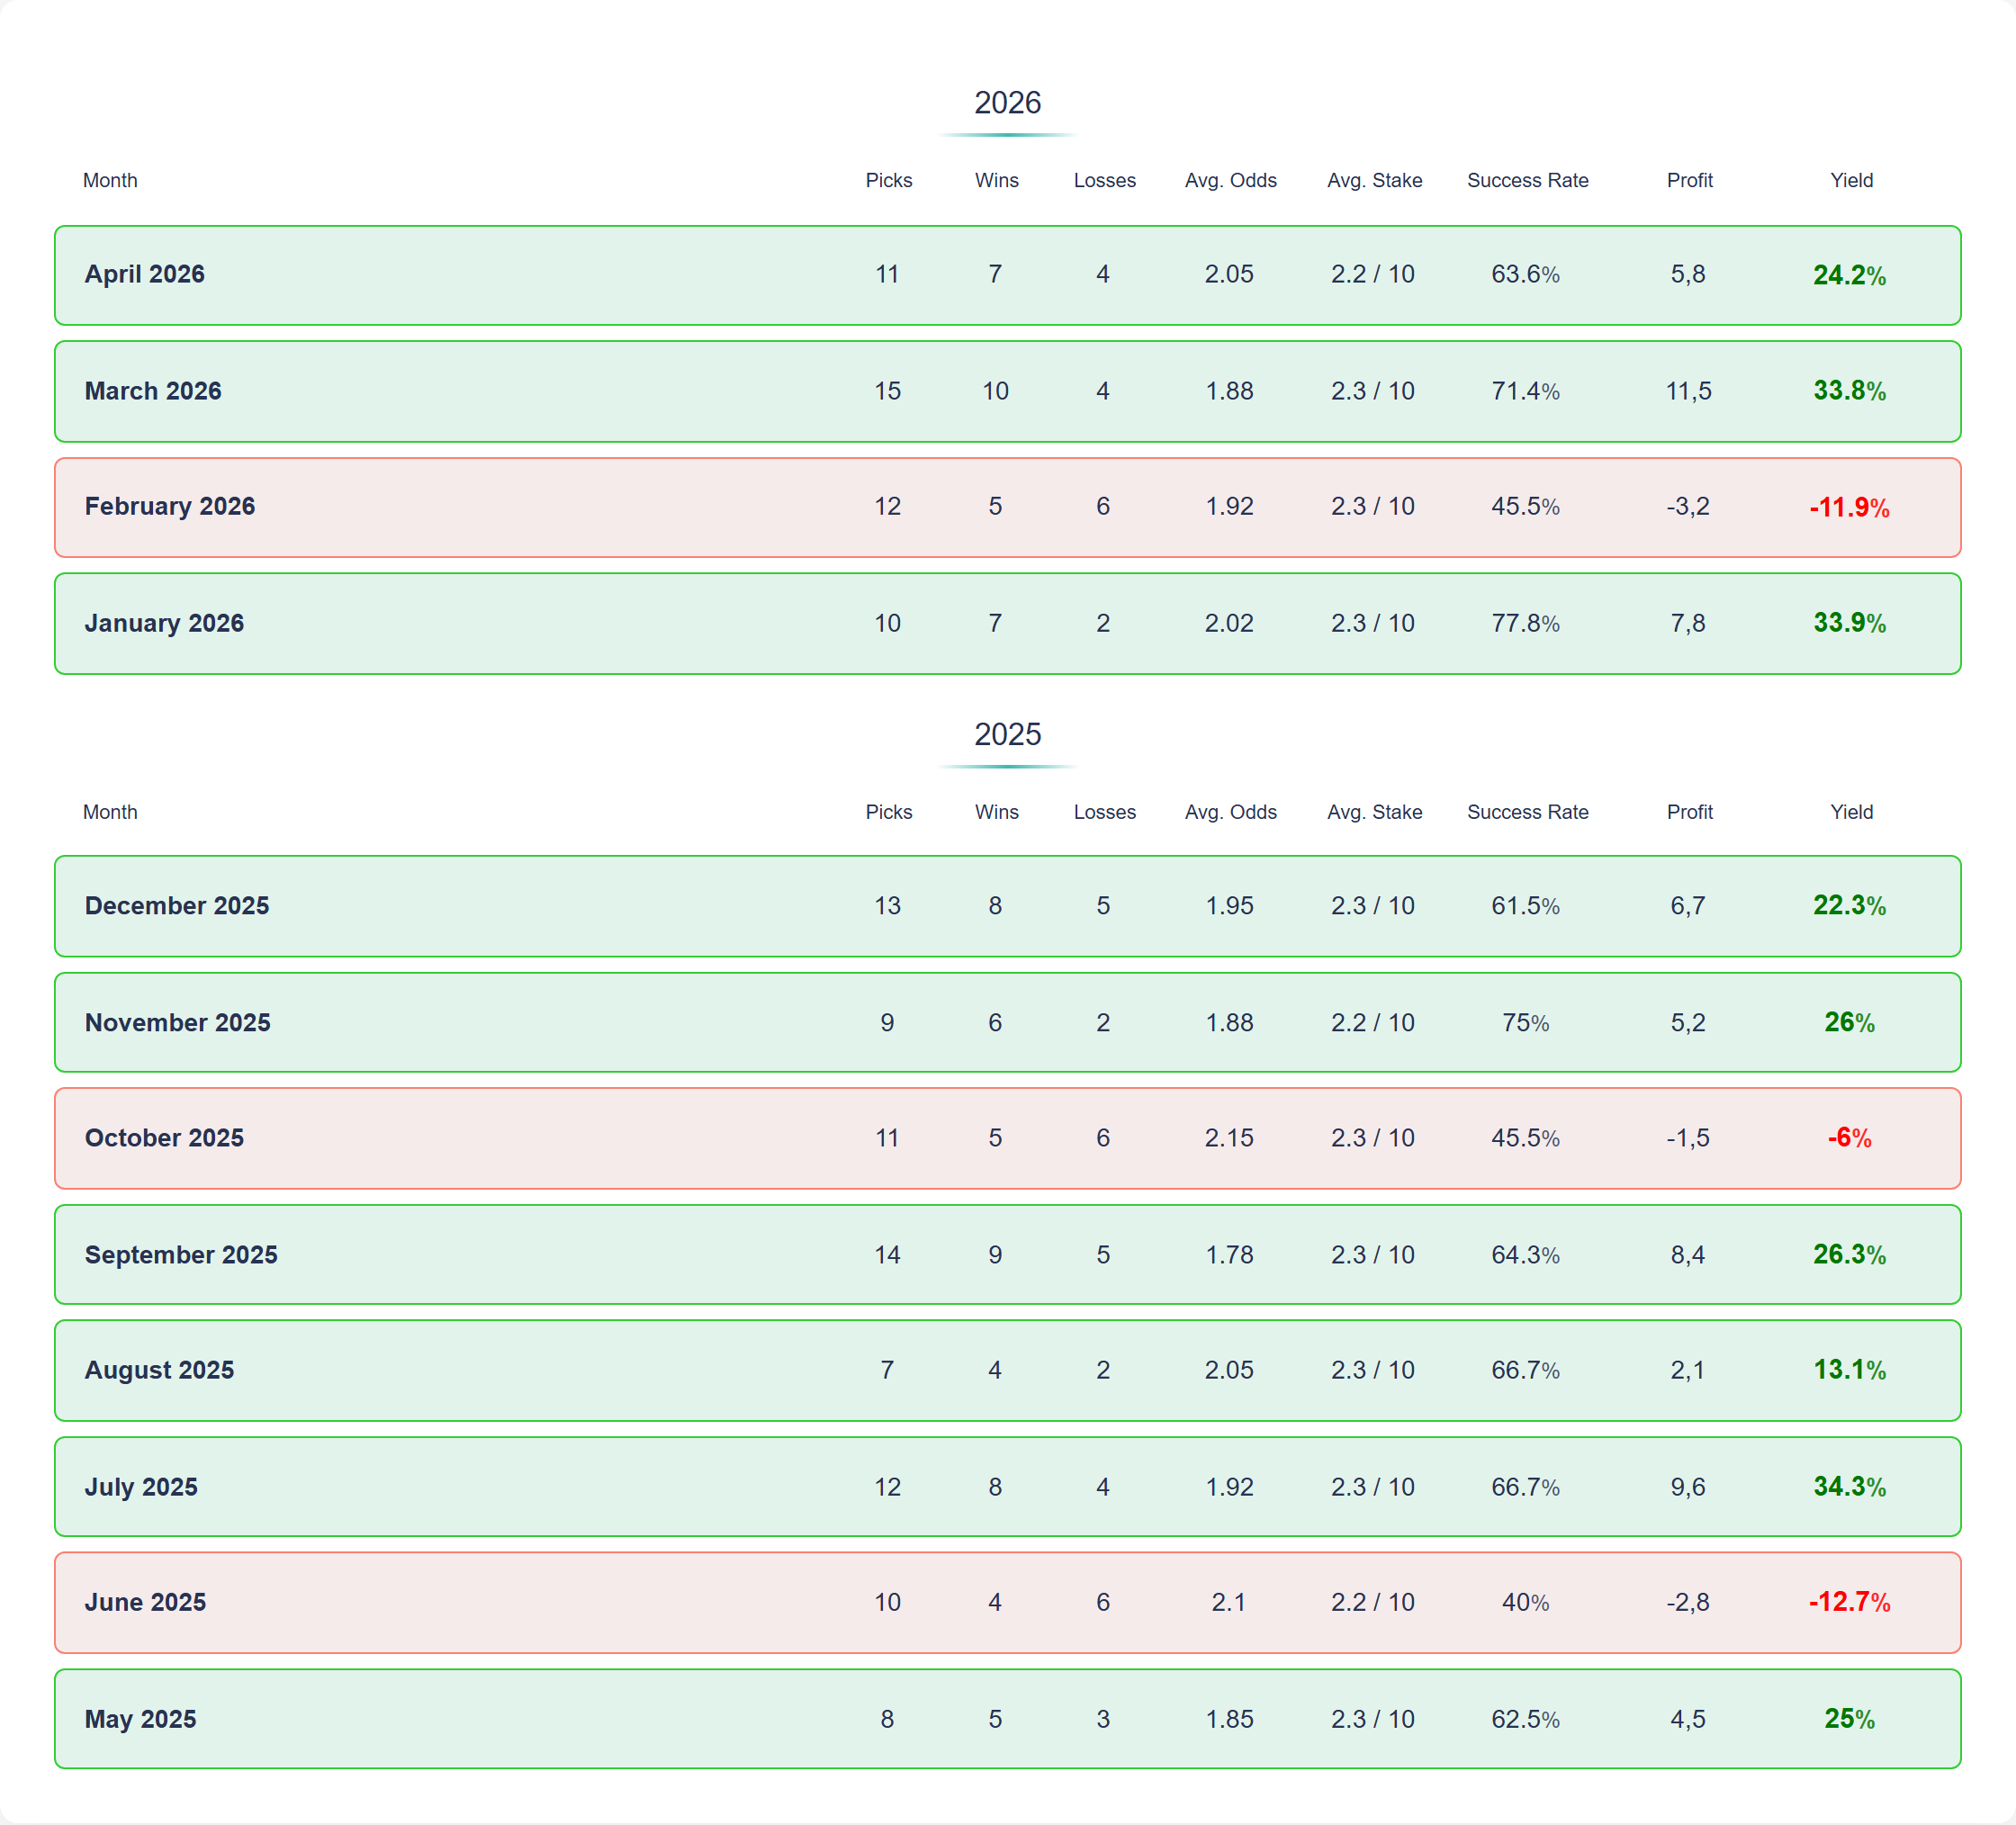
Pick results grouped by month. Each month displays total profit, yield, hit rate and number of picks. Click any month to see all picks from that period. This view helps you evaluate long-term consistency instead of focusing on one short winning streak.
How to evaluate a tipster
Numbers without context can be misleading. Here is a checklist we recommend:
- Sample size - minimum 30 resolved picks, ideally 100+. Less than that and yield is mostly luck.
- Yield over a long horizon - yield in the last 30 days can swing wildly. Look at yield in the Months Overview across many months.
- Drawdowns - every tipster loses streaks. Look at the profit chart: are dips recovered, or does the chart keep dropping?
- Activity - when was the last pick? An inactive tipster, even with great stats, is no use.
- Average odd vs hit rate - these are linked. A tipster betting 1.5 odds needs ~67 % hit rate to be profitable; 2.5 odds needs ~40 %. Numbers far from those break-even points indicate either an edge or a small sample.
- Stake discipline - Avg. Stake should be reasonably constant (1.5 - 3 / 10). Wild swings often mean chasing losses.